For our third challenge of the 2021-2022 program year, we were excited to partner with Brilliant Detroit, a nonprofit dedicated to building kid success families and neighborhoods where families with children 0-8 have what they need to be school ready, healthy and stable. Eight teams of Fellows worked collaboratively with Brilliant Detroit staff and community stakeholders to deliver this project – learn more from the perspective of each team!
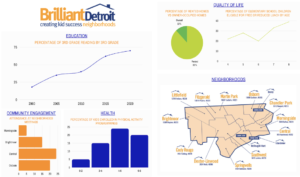
Our group’s key term for this project is “Dashboard”. A dashboard is a visual system that displays important outcomes that can show change. More specifically we were tasked with creating a dashboard that answers the question: how are the children doing? Our dashboard wants to do more than record changes in the Brilliant Detroit community, we want to record the changes in the overall neighborhood.
Our first goal for this project was to give a recommendation for which dashboard platform Brilliant Detroit should use of the data we hope to display. One of the considerations we had for the project was should the dashboard list aggregated Brilliant Detroit hub participant data alongside the neighborhood-wide data? As a group we felt that the answer to this question was a yes. We came to this conclusion because after interviewing stakeholders we got the impression that it would be important for the data to be available to be compared and contrasted. Another design question that our group was forced to consider was that the dashboard needs to be accessible visually to both the neighborhoods and external stakeholders. The question forced our group to really think outside the box on how we designed the visual aspects of the dashboard. We made careful considerations in the color scheming and data representation. These considerations can be seen in our deliverable dashboard where we paid careful attention to making sure that every piece of data had accompanying text and information to make it clear.
Another goal for this project was to create a Neighborhood Profile Mock-up. The idea behind the Neighborhood Profile was to creatively and clearly display a wealth of neighborhood information as outlined in the Community Scorecard document developed by Brilliant Detroit. Some of the key features that we made sure to highlight in the Neighborhood Profile mockup included a description of the neighborhood, where the neighborhood is located in relation to other Brilliant Detroit neighborhoods, and displays key data points about the neighborhood. We hope that our deliverables will make a difference for Brilliant Detroit and the neighborhoods that it helps.
***