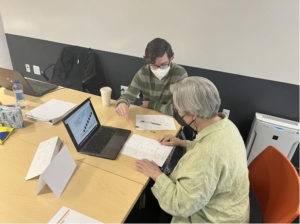
For our third challenge of the 2021-2022 program year, we were excited to partner with Brilliant Detroit, a nonprofit dedicated to building kid success families and neighborhoods where families with children 0-8 have what they need to be school ready, healthy and stable. Eight teams of Fellows worked collaboratively with Brilliant Detroit staff and community stakeholders to deliver this project – learn more from the perspective of each team!
Since Brilliant Detroit was founded in 2015, its growth has been unprecedented. Brilliant Detroit has gone from a small nonprofit to having an unmistakable presence in 12 Detroit neighborhoods. By 2024 Brilliant Detroit has the goal of being in 24 Detroit neighborhoods with the potential of expanding to other cities and countries. This growth is exciting but also comes with scaling concerns and questions, such as how to broaden their methodology of tracking and disseminating data.
As the Scaling Dashboard team, our job was to design a way to expand the developing data tool (The Dashboard) to incorporate new sites and hubs. Our main question was, “How might we embed this practice of creating dashboards in our work as we scale to new Detroit neighborhoods and potentially replicate it in other cities?”. Before addressing this question, we received valuable insight from Brilliant Detroit’s CEO, Cindy Eggleton. She stated, “Our biggest challenge is scaling our culture. We are having difficulty with that because it’s so localized”. We found this compelling and kept it in mind as we built our deliverables.

“What you are involved in is innovation!” – Cindy Eggleton, CEO & Co-founder, Brilliant Detroit
Our deliverables were closely tied to Brilliant Detroit’s existing documents in their scaling practices: the Scaling Plan and the Social Replication Toolkit. From this, we developed three deliverables. One was a slide to go directly into the Scaling plan PDF, a Prezi outlining a step by step plan and timeline titled “New Hub, New Dashboard Launch Guide,” and a process map that detailed if-then events for each step along the way. After testing, we received a great deal of feedback that included language changes, adding a timeline to the process, and considering how we could scale the dashboard to new sites and existing hubs that don’t already use the dashboard. From this feedback, we iterated on our deliverables so that we are confident they will contribute to making the dashboard bigger, better, and brilliant!
***

